Mobile Diaries & Moderated Discussions
Forsta Digital Diaries is the modern, social media-style research solution for insights pros seeking to truly understand how people think, feel and act. Capture in-the-moment perceptions, emotions and behaviors to successfully inform innovation, development, in-market placement and customer experience initiatives.
Innovations
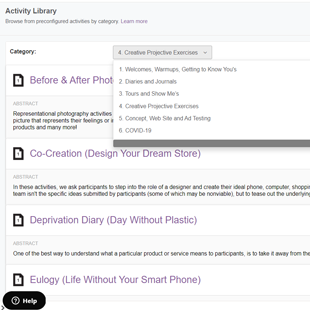
Templated activities save time and offer ideas during the design phase of a study.
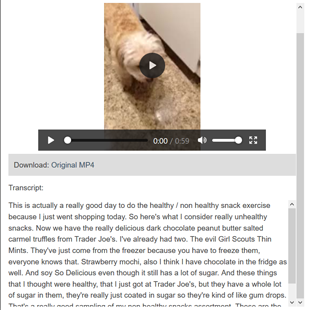
Transcripts expedite the moderation and analysis of narrated videos.
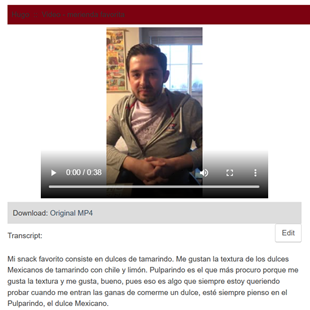
Transcripts are available in several languages and shortly after videos are submitted by participants.
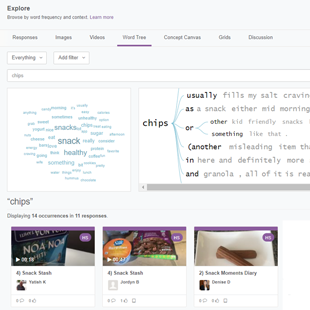
Text visualization tools to quickly find keywords in context.
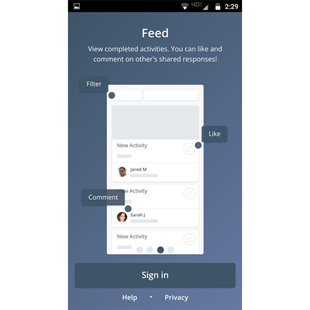
Native mobile app works in offline mode for capturing on-the-go behaviors, perceptions and opinions.
Participant Web Interface
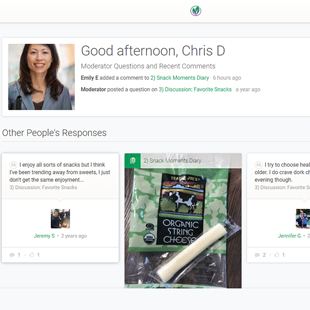
Offers an engaging, social media-style experience that increases participation and completion rates.
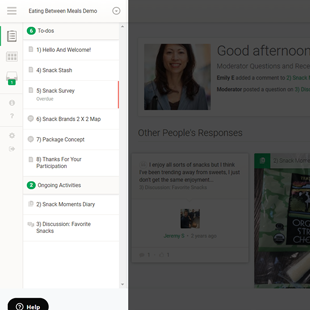
Sequential list of activities: private and social, web and mobile, one-time and recurring.
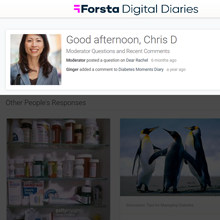
Moderator questions and social comments display in the interface and are sent via email in real-time to help keep participants engaged.
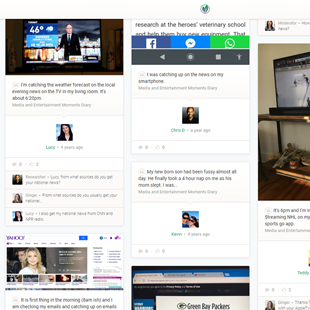
Participants can easily comment on and like other participants’ responses.
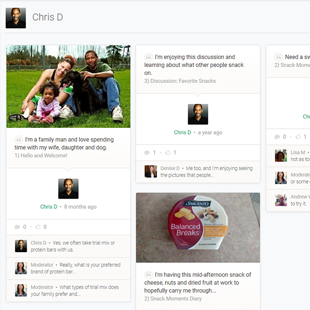
Participants can quickly access and review their submitted responses.
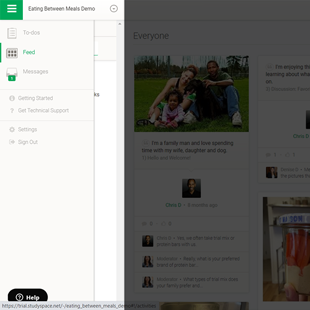
Participants can easily navigate to all areas of the project and contact technical support directly.
Participant Mobile App
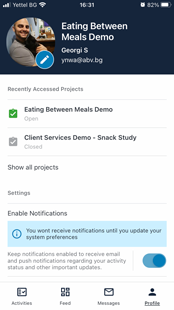
Participants can easily navigate to all areas of the project and contact technical support directly.
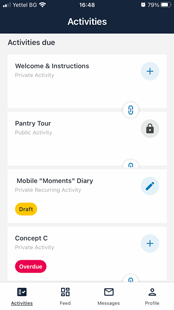
Sequential list of activities with colorful labels to alert participants to important information.
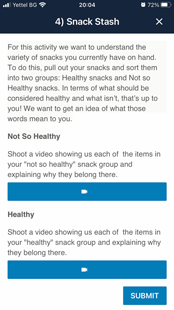
In app video recorder and faster uploading of videos than via a web browser.
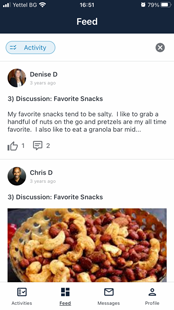
Participants can comment on and like other participants’ responses.

Participants are instantly notified whenever they receive a moderator probe or social comment.
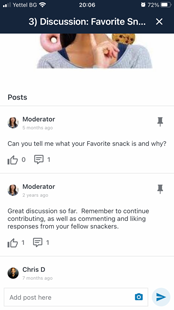
Participants can share insights in group Discussions with the entire community.
Researcher Web Interface
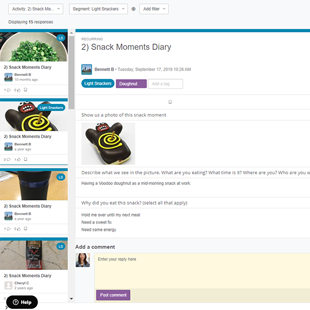
Wide variety of filters available to quickly narrow down your dataset.
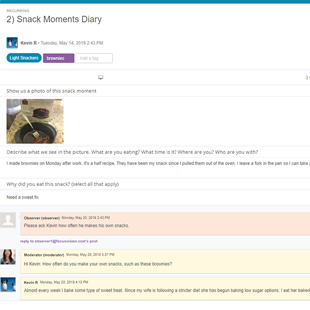
Drill down into each response to tag, probe and view accompanying comments.
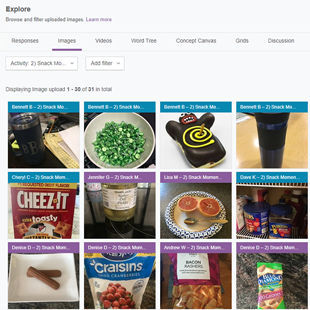
Download images one at a time or create a filtered image set.
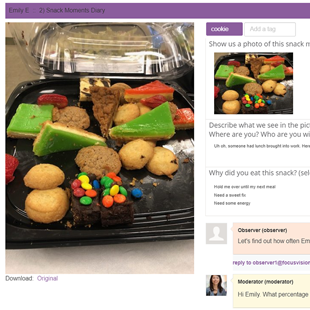
View responses with images and accompanying comments.
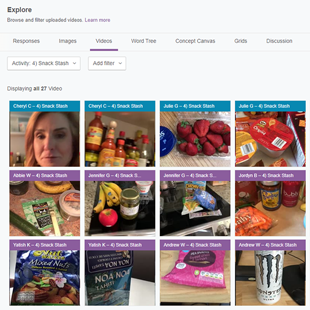
Download submitted videos in both their original and standardized MP4 formats.
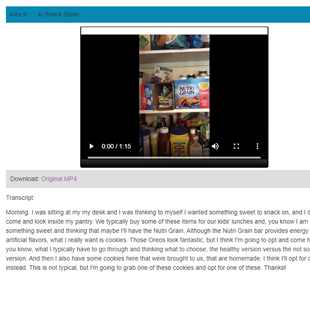
View individual video responses and accompanying comments.
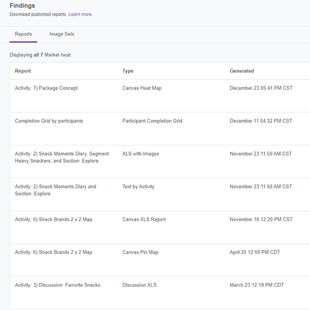
Manage and download a variety of report formats, both during and after fielding.
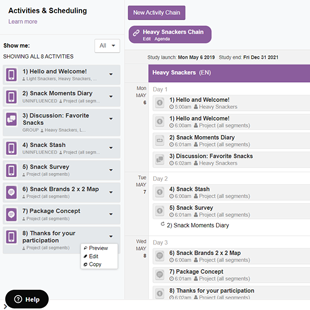
Create, schedule and manage all activities in one convenient location with an easy to use, drag and drop interface.
Immersive Activities
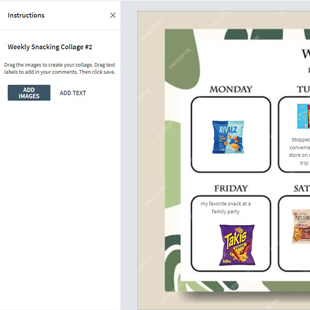
Participants drag and drop custom images and text stimuli to mark up a stimulus provided by the research team to better express emotion and context.
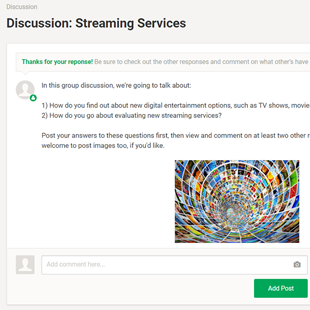
Researcher can share both text and stimuli; participant progress bar increases participation and completion rates.
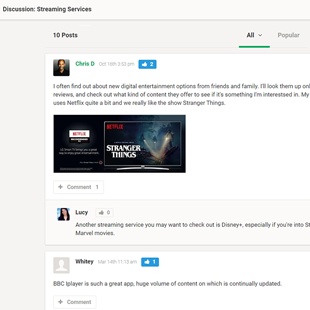
Social media-style interactions and chronological feed for ease of navigation.
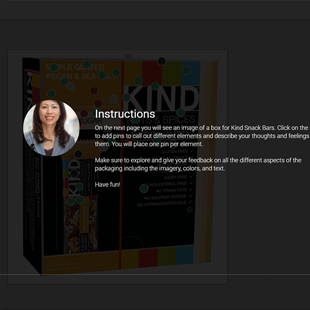
Fully customizable Concept Canvas activity instructions.
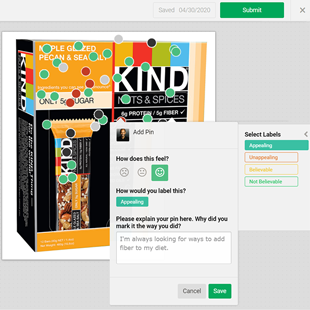
Participants place pins on stimuli and give a sentiment rating, select from customized labels and provide open-ended feedback.
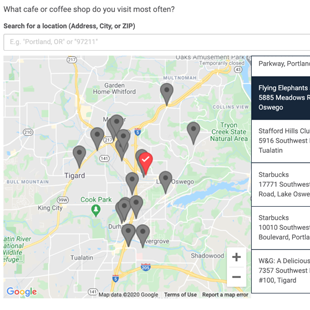
Participants indicate the exact location they visited via Google Maps.
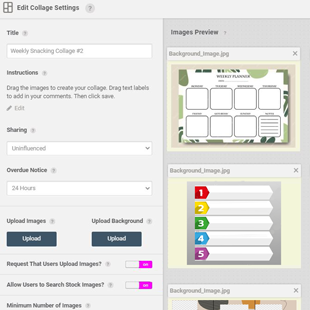
Evaluate participant collages and further engage or probe for additional insights.

Filters to quickly narrow down discussion contributions and chronological feed for ease of navigation.
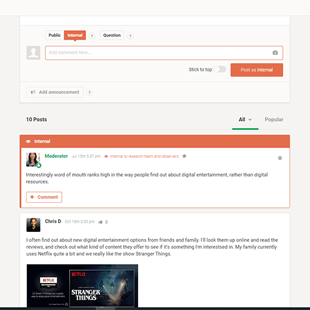
Have internal, backroom discussions that aren’t visible to participants.
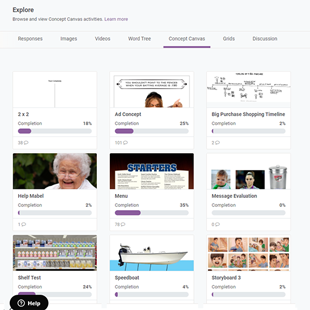
Concept Canvas activities are effective for evaluative and creative perceptual exercises.

View participant responses in heatmaps and sentiments in colored pin maps.
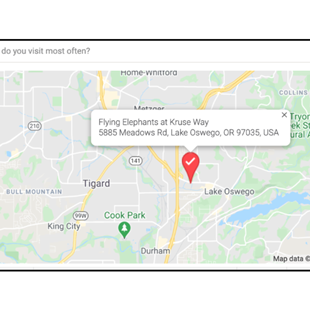
Location responses contain the map for the question with a red pin reflecting the exact location and address.
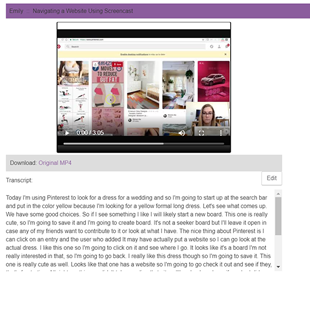
Participants can use an app to record their computer screens, capture audio and webcam video simultaneously.
Project Management
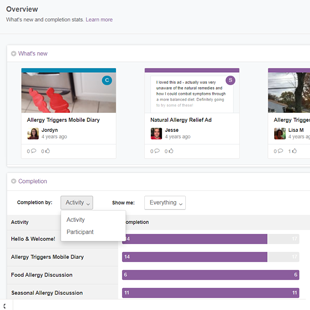
Newest responses and filterable completion grids display to quickly see how a project is progressing.
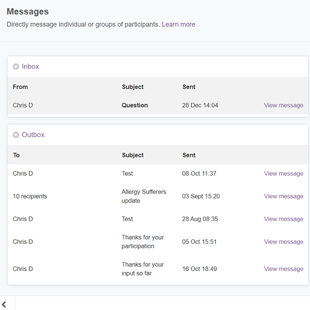
Send and receive direct messages to and from participants, triggering instant notifications.
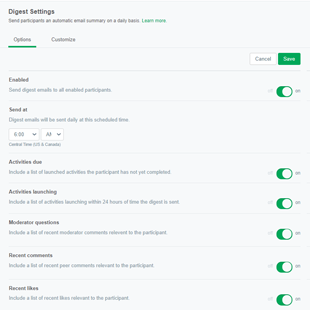
Keep participants on track and engaged with automated daily update emails.
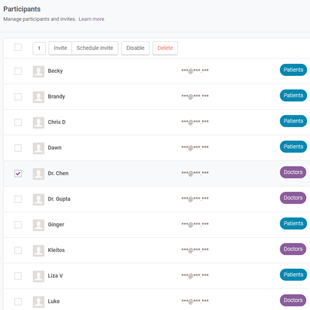
Obscure identifying participant information both in the platform and in data exports.
Reporting
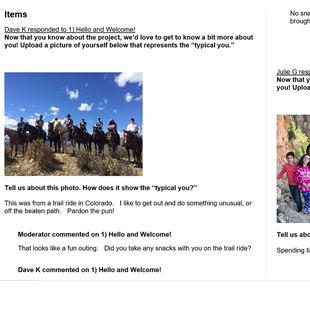
Text reports automatically adjust image sizes so they fit nicely on each page.
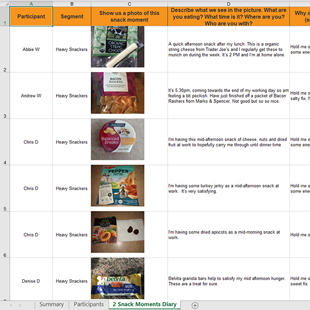
Our popular, time-saving Excel with Images reports contain several tabs and a wealth of details.
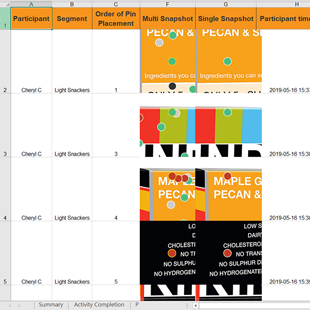
View where individual pins were placed on stimuli and the corresponding feedback given.
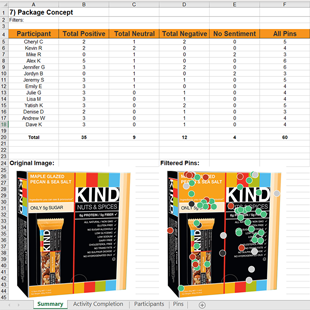
View tallying of sentiment ratings and filtered pin and heatmaps.
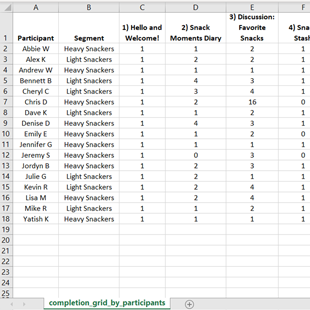
Generate completion grids in real-time by participants and activities.
Search for and identify themes within the language people are using in a project.
