View our Product Previews Below
Centralized research and data management
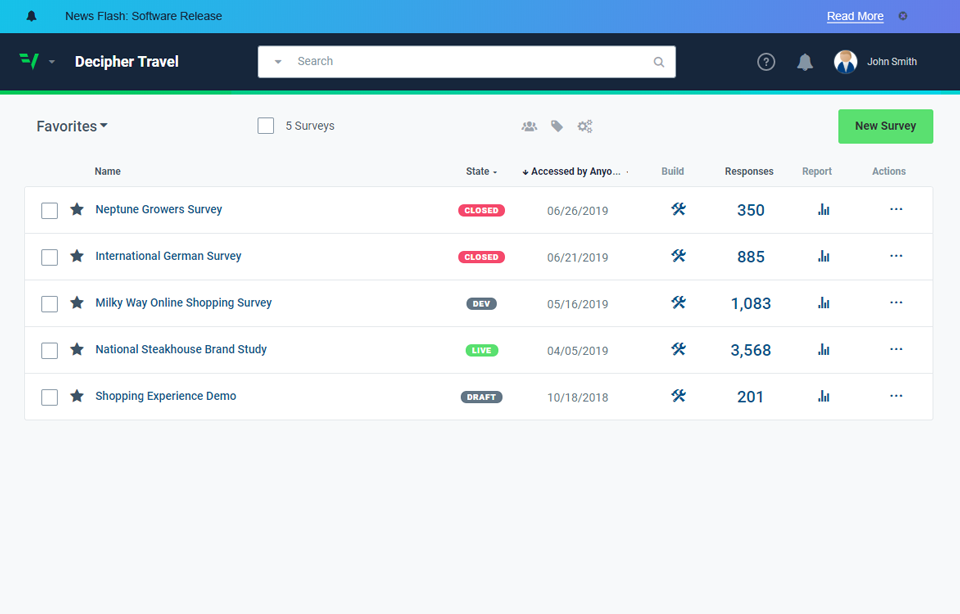
Quickly locate and access your survey projects, duplicate projects and export your survey into many different available formats including PDF, Word, Text and HTML. Clicking column headers will sort the projects by the corresponding fields giving you the access you need.
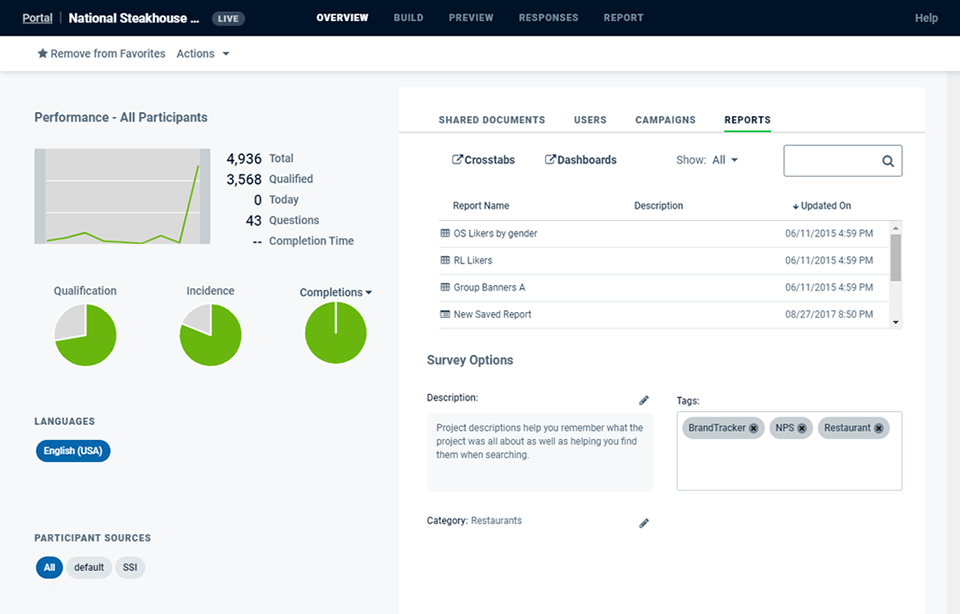
Drill down into project specifics obtaining real-time data. This detailed view provides quick access to project progress, direct links to reports and dashboards and a shared project file repository. Reporting stats can be filtered and include: qualification rates, incidence rates and completion rates. Need to find a project quickly? Use the Tag option to organize projects and search.
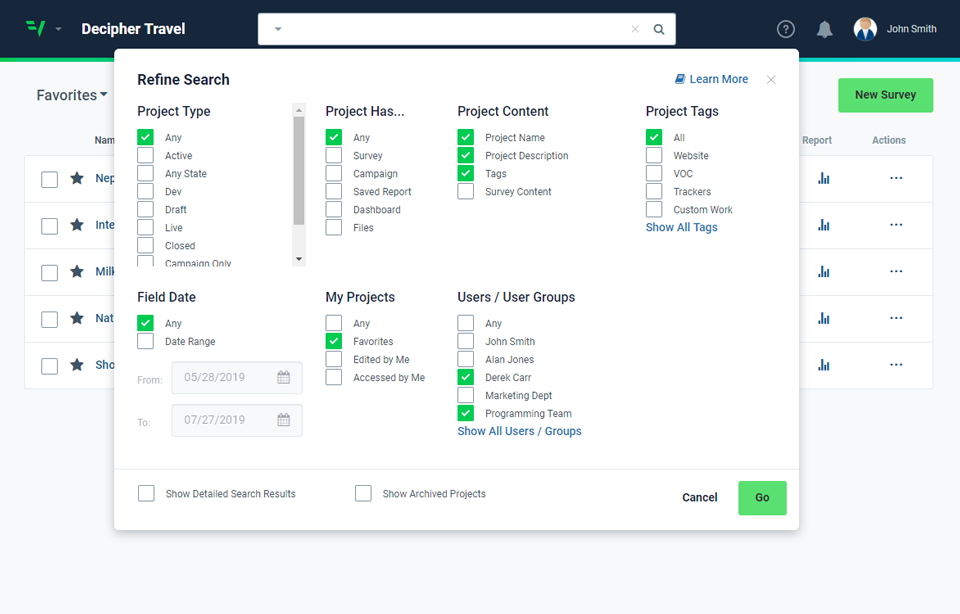
Powerful search capabilities enable searching across and within projects with ease. Use the Refine Search menu to further filter your results. Easily search for projects by words, phrases, project type, content, tags, dates, user groups and much more. All searches can be saved and used in the future.
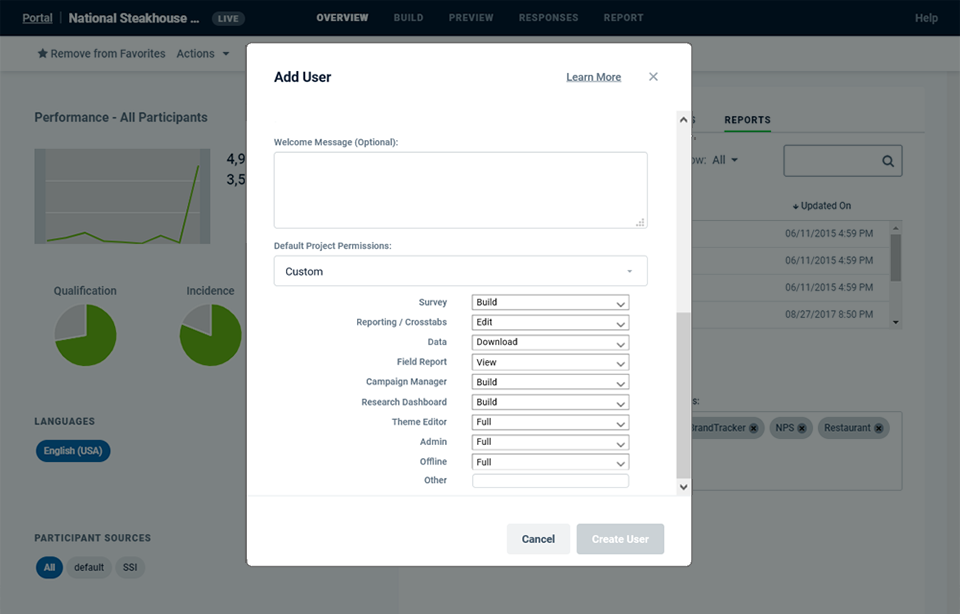
With just a few clicks, assign user permission levels with specific access based permissions. Quickly add teams of people to a project by creating one or more user groups.
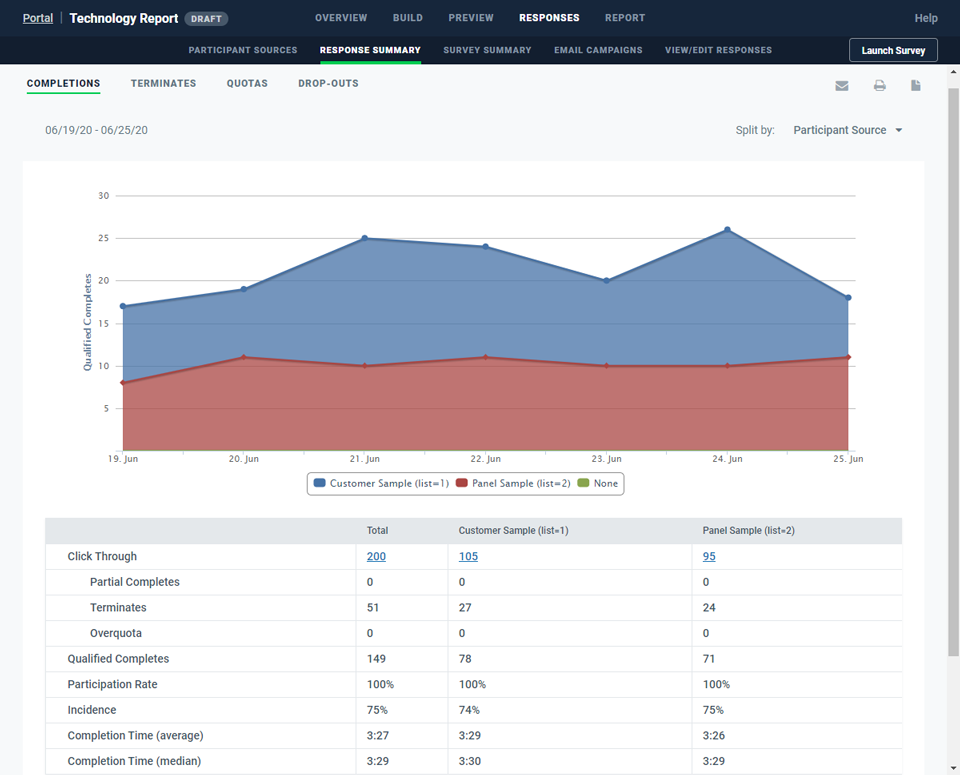
Real-time data collection management
Monitor real-time project progression when fielding. Track completion rates, terminates, quotas, drop-outs and email campaigns. Views can be split by a variety of metrics such as respondent source, device type, languages, OS, browser or a custom variable.
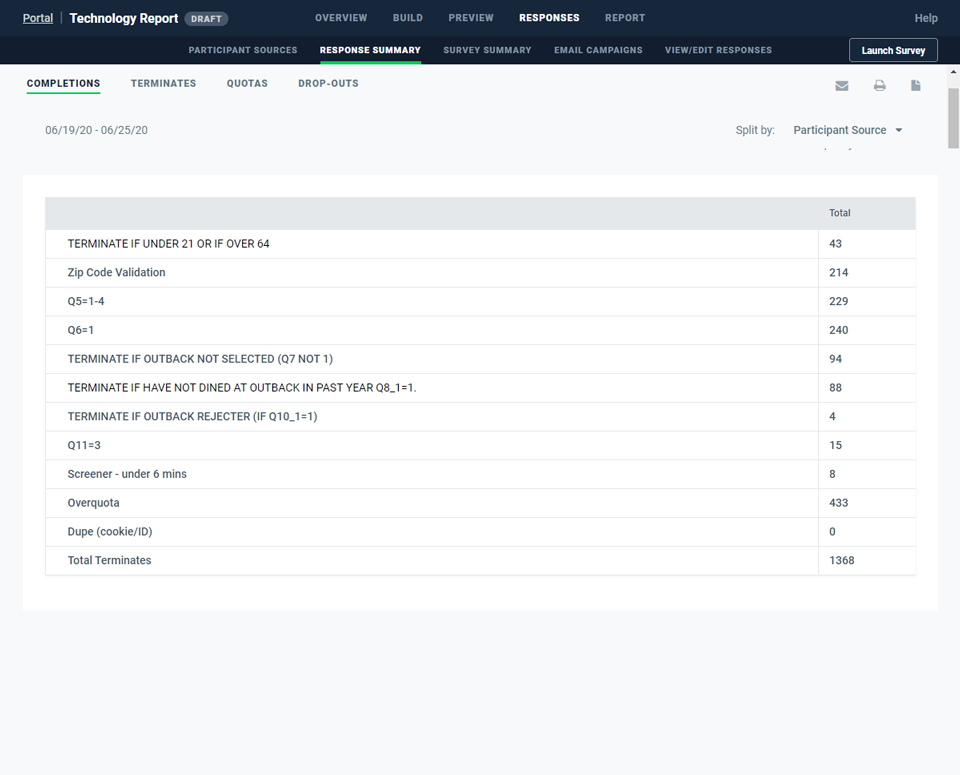
Access a comprehensive breakdown of terminate segments and the total number of respondents that have been terminated for each segment.
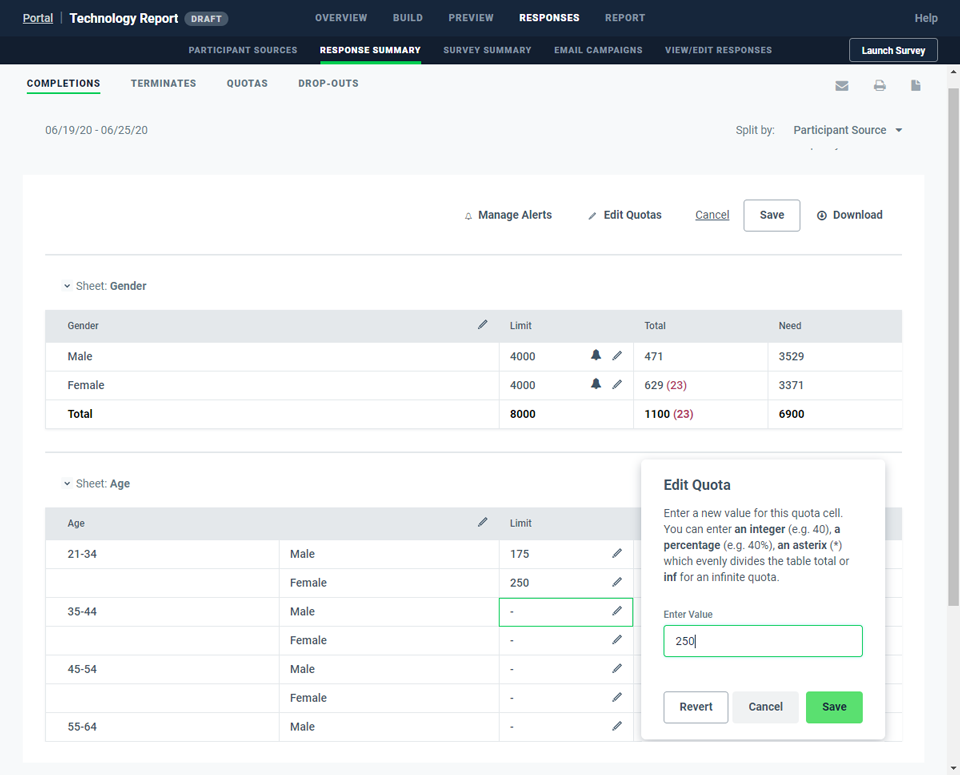
Track important distributions like demographics or concepts in real time. With the ability to modify quota limits, you don’t have to edit your original survey or pause fielding. Easily set up alerts to notify when limits are reached.
Crosstab creation with ease and speed
Access up-to-the-minute results with real-time reporting. Review survey data and dissect it by various segments that you can save for team collaboration or personal use.
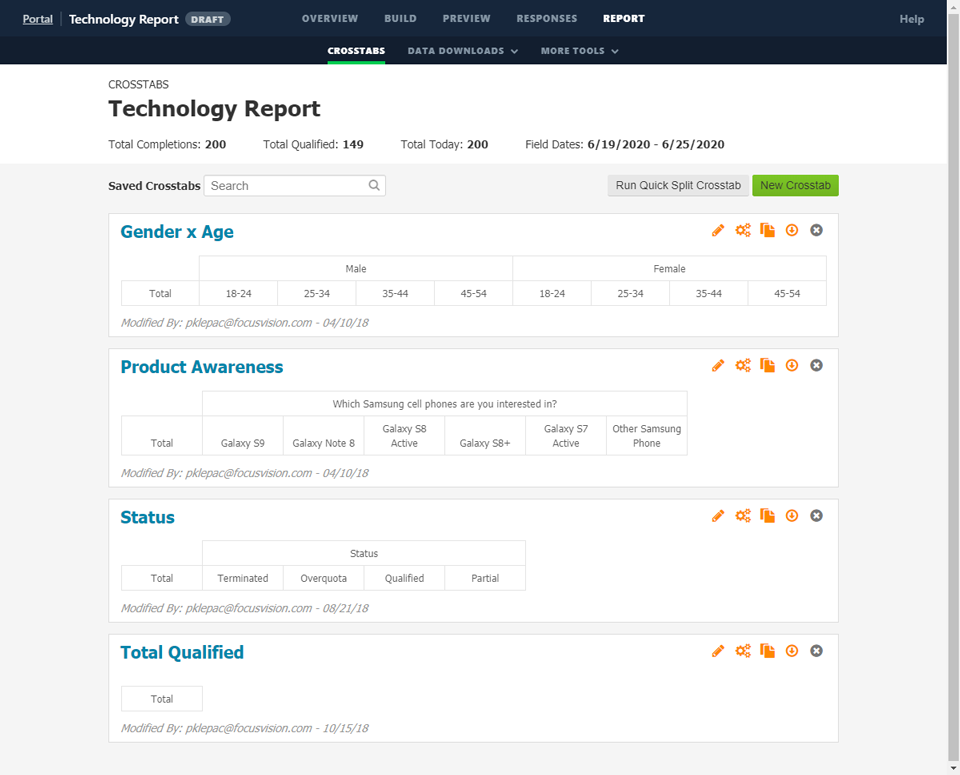
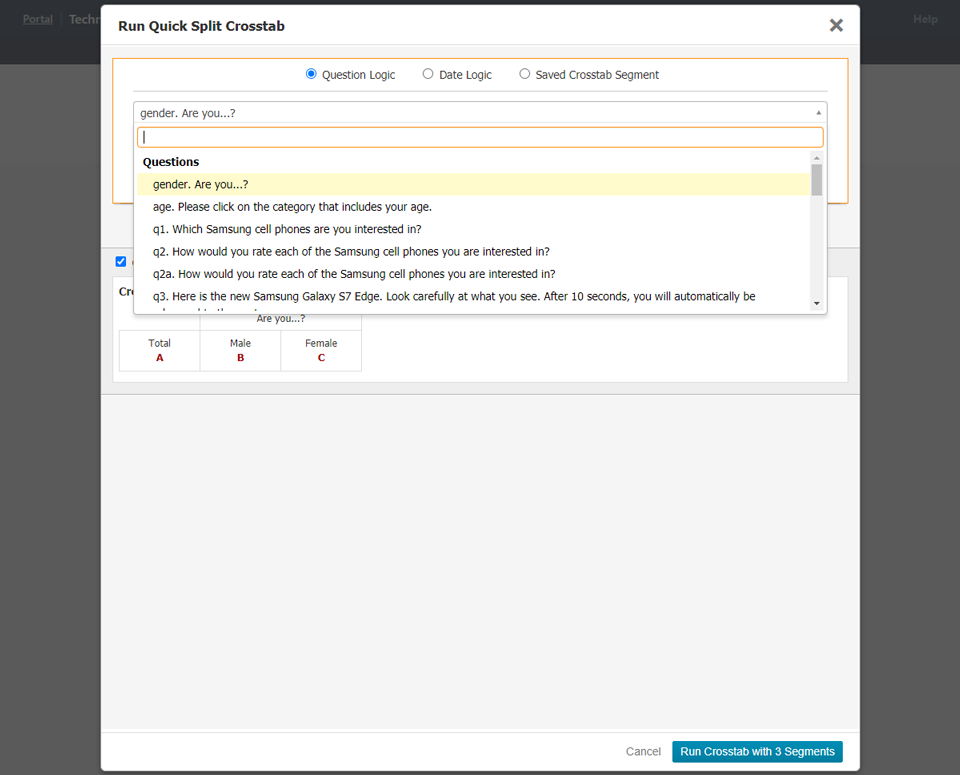
Quickly create nested or appended banners with just a few clicks. Fully customizable reporting banners can be based on any information that is part of the survey project.
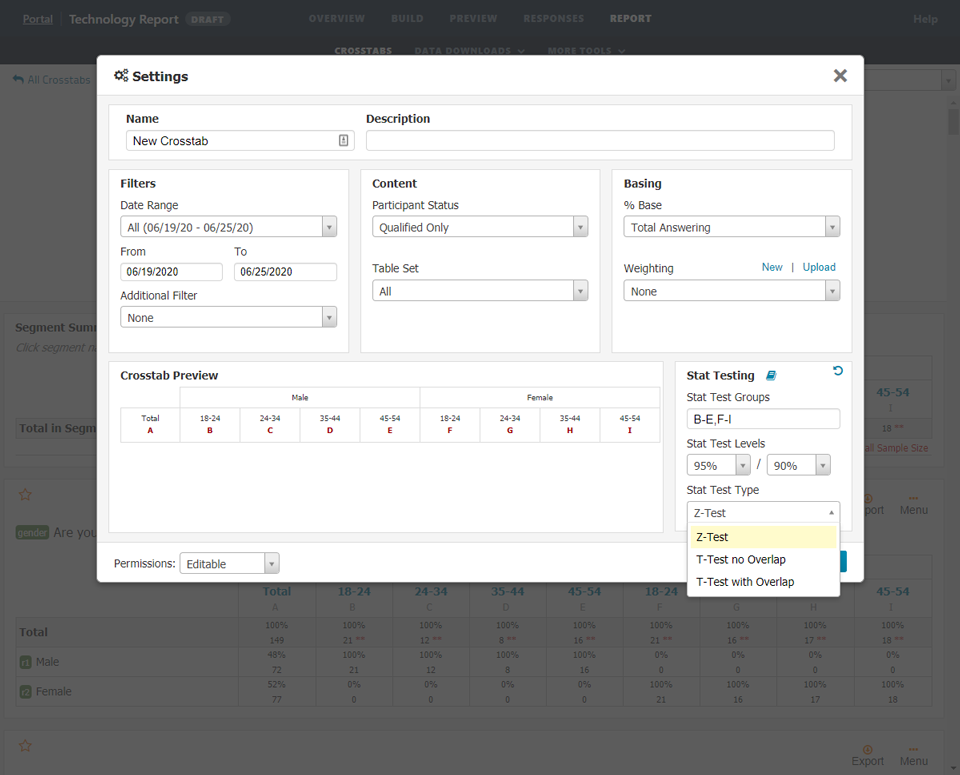
Analyze results by changing bases, applying weighting and modifying stat testing groups, levels and type. Reporting banners can be filtered by a variety of standard attributes like date ranges and participant status, as well as by custom filters.
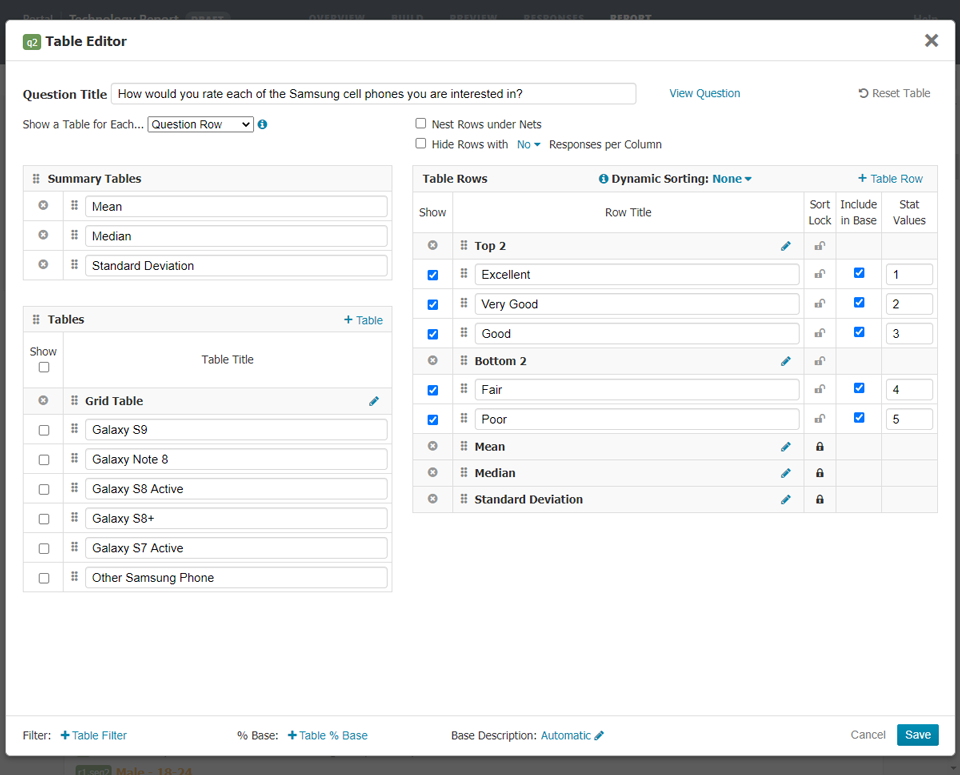
Tables are fully editable across all elements along with quick access to features such as per-table filtering, custom bases, dynamic sorting, threshold filtering, point-and-click nets and nested nets, as well as statistics.
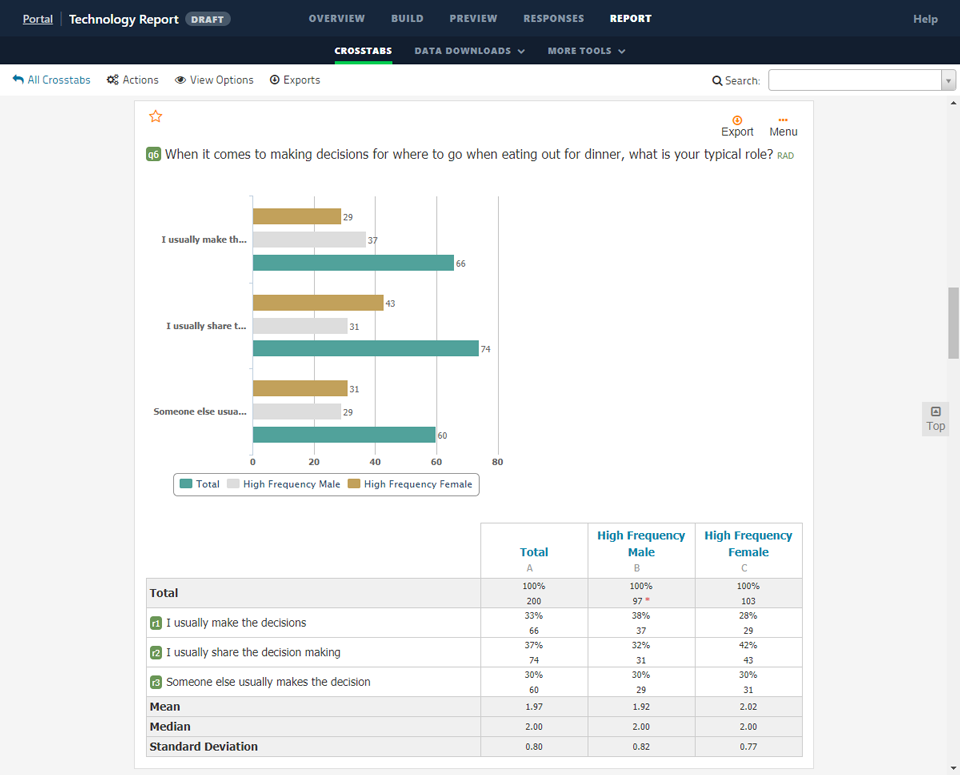
Add a variety of chart types for a more intuitive analysis to each table. Charts can be exported to Excel and PowerPoint, as well as added to Saved Reports for live curated reports that can be shared.
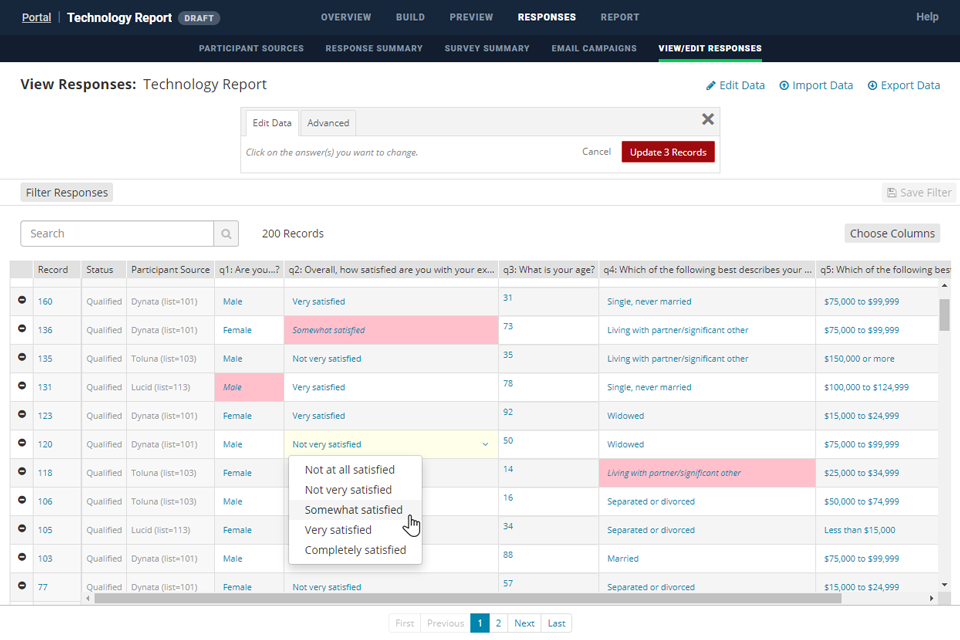
View and edit participant records on an individual level. Responses can be easily filtered by multiple criteria, to support data cleaning and editing, either individually or in bulk.
Easy access to reporting deliverables
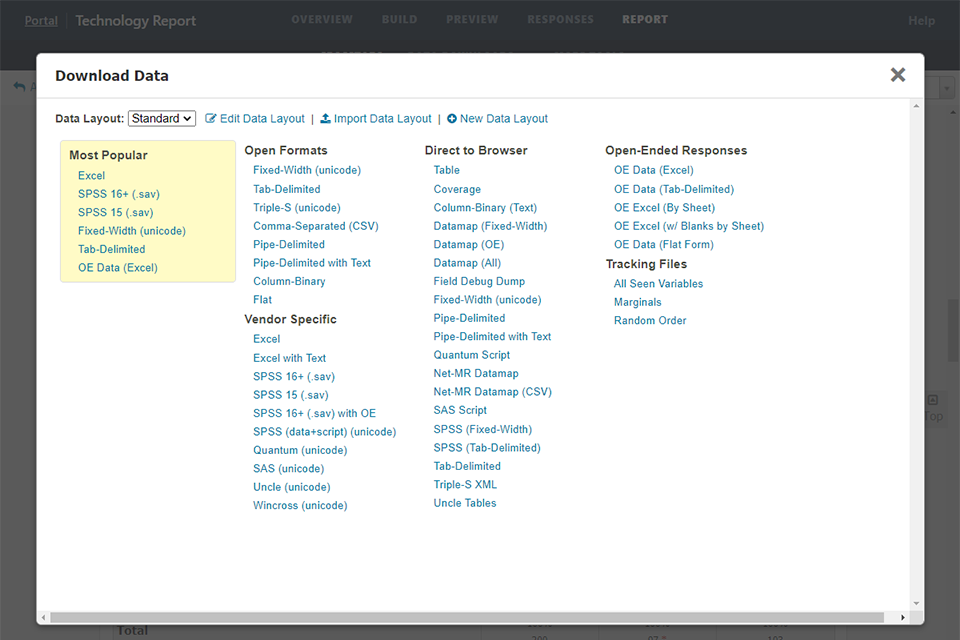
Over 45+ different data export layouts and formats to fit your every need. Data map layout, labels and values can all be adjusted for additional flexibility.
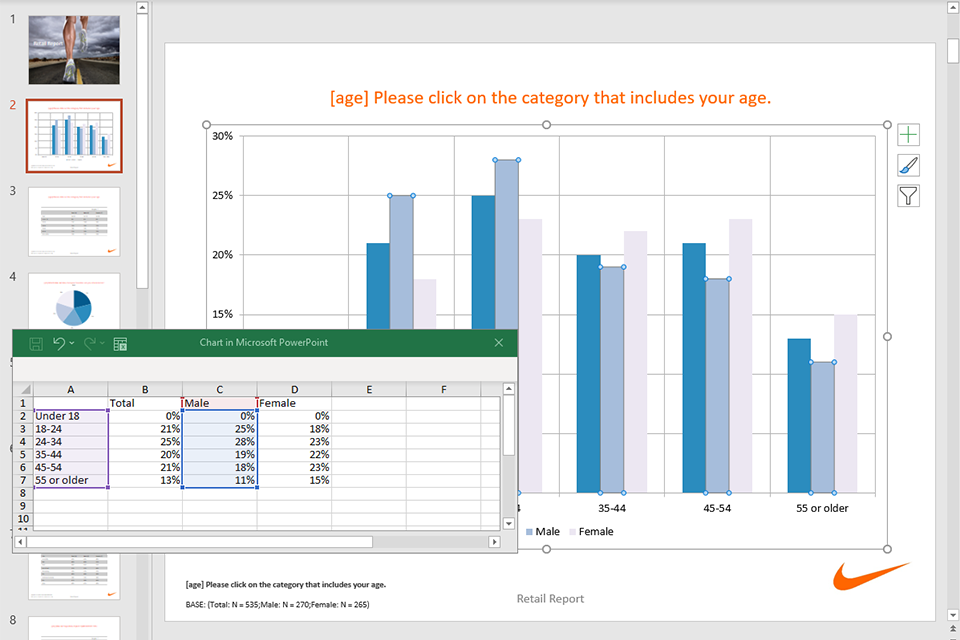
Instantly share your visual story with key stakeholders. Access our one-click export to native PowerPoint with fully editable charts and tables.
Interactive visualization reporting with video chart overlay enabling you to analyze every second of a video that is evaluated.
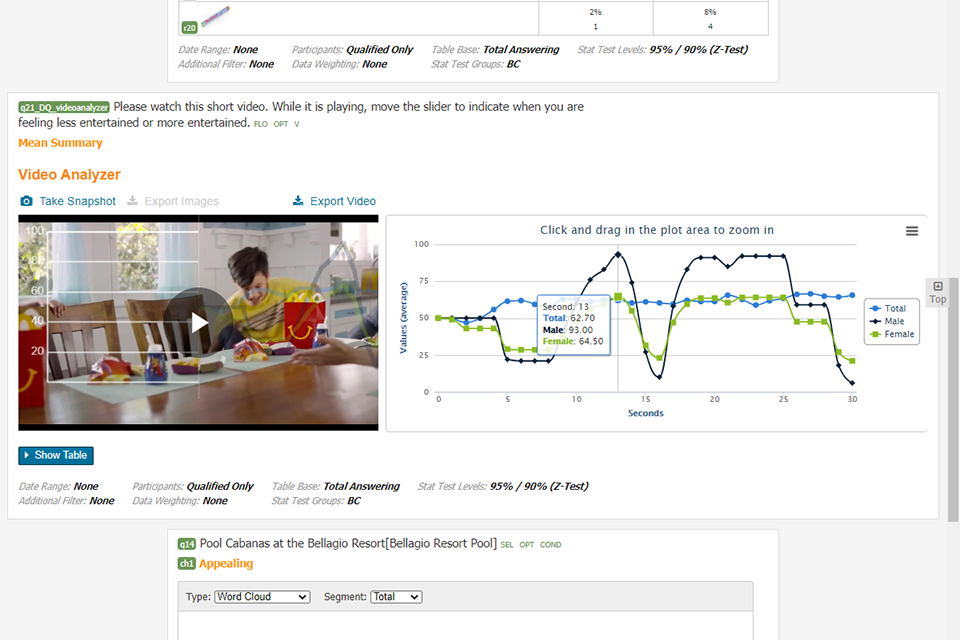
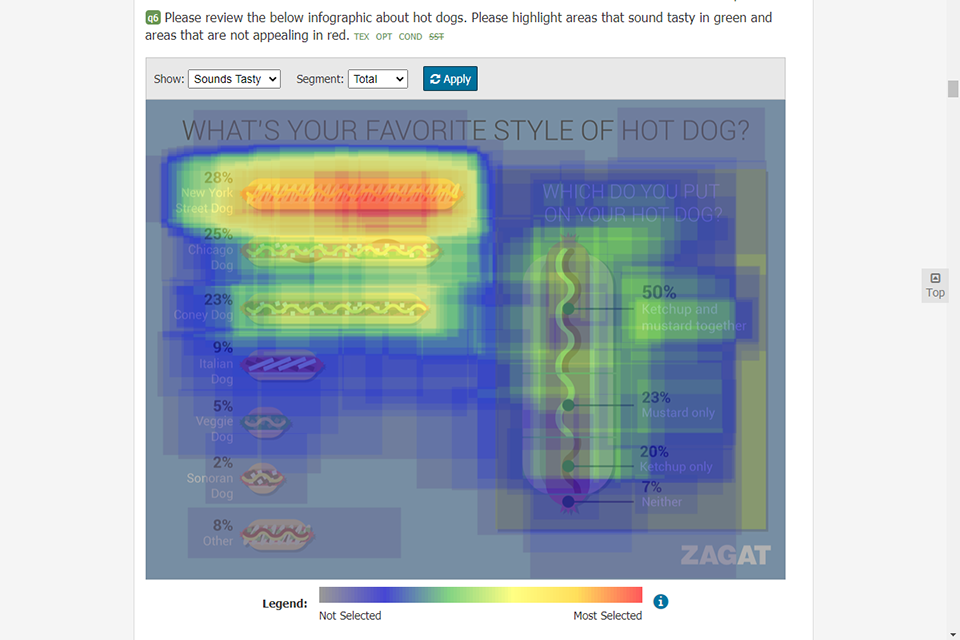
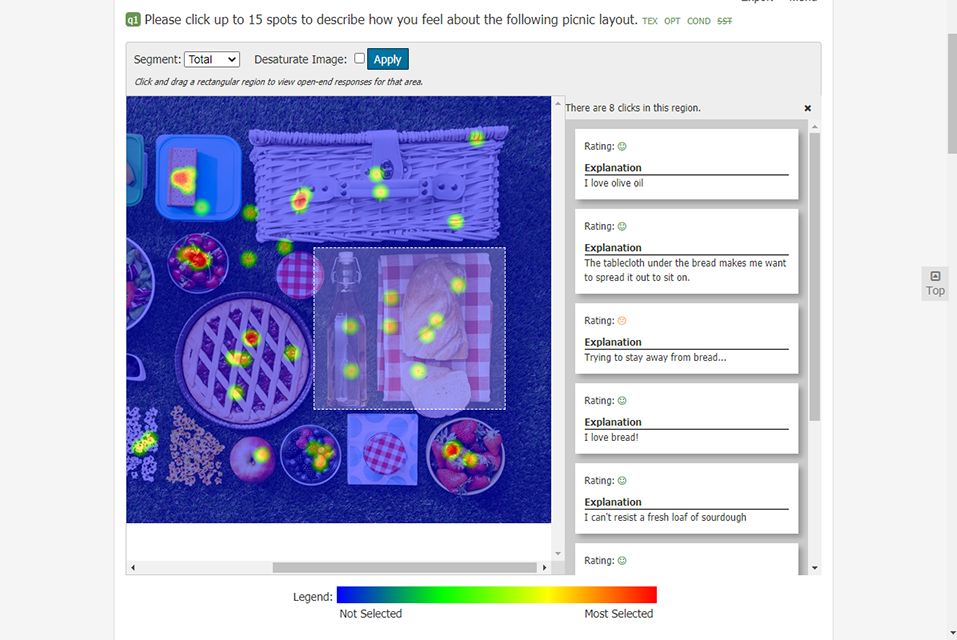
Image Highlighter question type provides an intuitive heatmap reporting output for visual analysis.